Six years after the Black Summer fires, SmartSat’s SAEcoMap project is using a nested stack of ground, drone, airborne and satellite data to address a focused question. Can current hyperspectral satellites reliably distinguish native vegetation communities from invasive species establishing after fire?
When half an island burned
Kangaroo Island is a big place. At more than 440,000 hectares, with over a third of it held in nature reserves, it has long been one of South Australia’s great refuges for native species, many found nowhere else on Earth.
In the summer of 2019 to 2020, much of it burned. Lightning ignited the island’s north on 20 December 2019, and ten days later struck the west, inside Flinders Chase National Park. Over the following weeks the fires moved through roughly 211,000 hectares, close to half the island, in the largest bushfire event in Kangaroo Island’s recorded history. Two people lost their lives, and dozens of homes and businesses were destroyed. In the biodiversity-rich west, around 96% of Flinders Chase National Park and the adjoining Ravine des Casoars Wilderness Protection Area burned, much of it at high to very high severity.
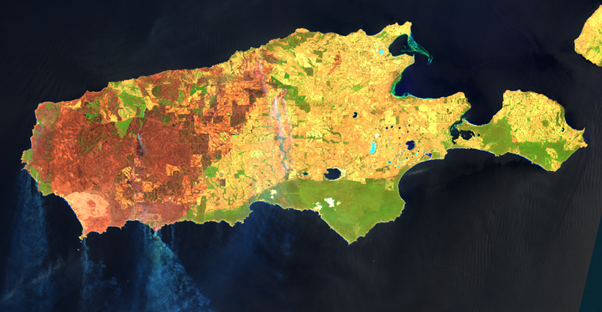 Landsat False Colour (Green, SWIR, NIR), taken on 9 January 2020, Kangaroo Island, South Australia
But these are fire-adapted systems. The mallee woodlands and shrublands (NVIS major vegetation group 14) and eucalypt woodlands (MVG 5) that dominate western Kangaroo Island are built to regenerate. The pressing question for land managers is not whether the bush returns, but what returns, where, and whether the regrowth is recovering native community or invasive species exploiting the disturbance, and how any of that can be measured reliably across half a million hectares.
The challenge: spectrally similar, ecologically distinct
This is harder than it sounds, because the vegetation types that matter most here are easy to confuse. Recovering native mallee, eucalypt woodland, and invasive wildlings such as Tasmanian blue gum (Eucalyptus globulus) spreading out from old plantation stock can look almost identical to a conventional satellite. The freely available multispectral workhorses, Sentinel-2 and Landsat 8/9, capture the landscape in only a handful of broad spectral bands, and that coarse spectral sampling struggles to separate communities that are ecologically distinct but spectrally similar. Distinguishing blue gum from certain native canopies is a known, persistent failure mode.
Hyperspectral sensors, which resolve hundreds of contiguous narrow bands, should in principle do better. Narrow-band sampling captures subtle differences in canopy biochemistry and structure, such as pigment concentrations, the position of the red-edge inflection point, and water-related absorption features, that broadband sensors smear over. The presumption has long been that this finer spectral detail translates into better discrimination of similar vegetation. But that advantage is widely assumed and rarely tested for Australian conditions. A thorough review found no published satellite-hyperspectral studies (as of early 2026, to the team’s knowledge) of post-fire vegetation recovery in Australian ecosystems,, a clear gap in the literature.
That gap defines SAEcoMap’s central question on Kangaroo Island. Can existing and emerging hyperspectral satellites differentiate invasive from native species, and at what spatial and spectral resolution does that capability hold or break down? The project, led from Adelaide University under SmartSat CRC, with the Department for Environment and Water (DEW), Primary Industries and Regions South Australia (PIRSA) is built to answer it with evidence rather than assumption.
A nested benchmark: field to drone to aircraft to satellite
The methodological heart of the project is a multi-scale, multi-sensor reference stack. This is a deliberately layered set of datasets, each at a different spatial and spectral resolution, that together provide the benchmark against which the satellite hyperspectral sensors are evaluated. The logic is to fix a high-confidence reference at fine resolution and then test how much discriminating power survives as you coarsen toward what a satellite can deliver.
At the base are ground surveys. KILB’s field vegetation data provide validated, community-level labels for training and validation. Above them sits drone (UAV) LiDAR, which builds extremely dense three-dimensional point clouds, on the order of a few thousand points per square metre, resolving fine-scale canopy structure but over areas too small to scale regionally.
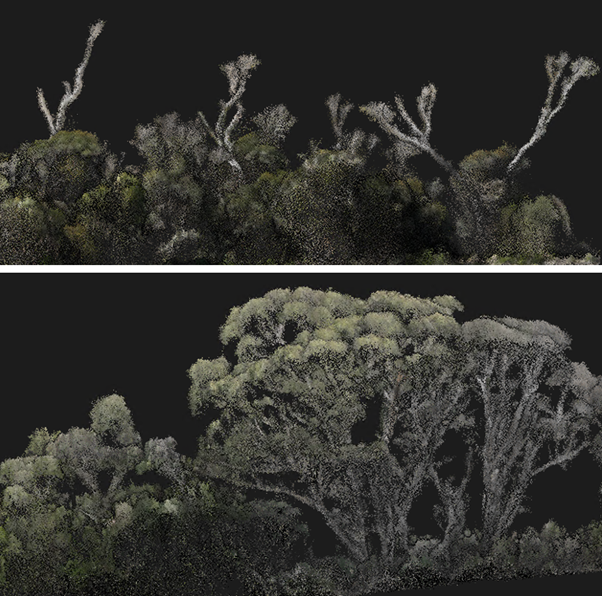 Top image: UAV colorised LiDAR 3D point cloud. Eucalyptus diversifolia dominated mallee Bottom image: Riparian Eucalyptus cladocalyx (Sugar Gum)
The airborne tier bridges that gap in two ways. Airborne laser scanning (ALS), commissioned through Airborne Research Australia, flown from a crewed aircraft at a far sparser density of around 25 points per square metre, is collected along survey flights lines of western Kangaroo Island and links the dense drone structure to a scalable footprint. Alongside it, airborne hyperspectral imaging, at roughly ≤1 m spatial and <10 nm spectral resolution) provides the upper benchmark for species discrimination. It represents the best achievable separation of invasive and native canopies, and the reference against which the influence of degraded spatial and spectral resolution can be quantified.
At the top is the satellite tier, the operational, repeat-coverage layer, and the level at which the project ultimately needs answers. Multispectral data (Sentinel-2, Landsat 8/9) supply the dense time series for monitoring, while the hyperspectral satellites are the instruments under assessment.
These tiers are complementary by design, mapping onto the three dimensions of post-fire recovery. Multispectral time series track changes in leaf area, LiDAR resolves vegetation structure (height, canopy density, biomass), and hyperspectral data target vegetation composition and species identity. Fusing structural and spectral information, anchored to ground truth, describes a recovering community far more completely than any single modality, and lets the team isolate exactly what hyperspectral satellites add over the freely available multispectral baseline.
Critically, Kanyini was not part of this benchmark. South Australia’s pioneering hyperspectral small satellite originally anchored the project, but with usable acquisitions limited to two scenes over the island, it served instead as an early proof of concept, discussed below, while the benchmark itself rests on the field-to-airborne reference stack. For context, Kanyini’s HyperScout-2 records 45 spectral bands across the visible to near-infrared (400–1000 nm) at roughly 70 m GSD, with no shortwave-infrared coverage, a configuration suited to a proof of concept rather than to fine species discrimination.
Early results: proof of concept and cross-sensor behaviour
Even those two Kanyini scenes were instructive. A Random Forest classifier trained on NVIS 7.0 Major Vegetation Groups (MVGs) separated the island’s communities with around 90.6% and 91.4% overall accuracy across the two dates. It reached 96% on the mallee woodlands that dominate Ravine des Casoars and Flinders Chase, and 98% on cleared/non-native cover (MVG 25), within which unsupervised k-means clustering was used to begin isolating blue gum plantations. Eucalypt woodland (MVG 5) was harder at 84%. The exercise established that even 70 m GSD (VNIR-only, 45-band) hyperspectral data carries usable community-level signal, motivating the move to higher-resolution sensors rather than serving as a yardstick for them.
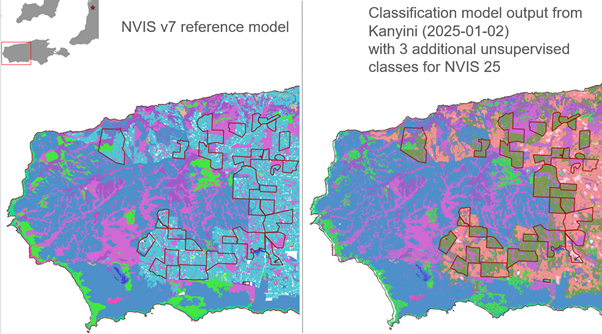 Left: NVIS reference model. The red border lines/vector outlines forestry plantation estates, primarily Eucalyptus globulus, which were initially all grouped under the single class MVG25 (Cleared, nonnative, buildings).
Right: classification map for western Kangaroo Island using Kanyini hyperspectral dataset acquired on 2025-01-02.
With Kanyini constrained, the team pivoted to a broader sensor pool: commercial providers Wyvern and Pixxel for higher spatial resolution, alongside open-access DESIS, EMIT and PRISMA. Cross-sensor comparisons against the Sentinel-2/Landsat baseline are already revealing systematic, sensor-specific behaviour that any operational use will have to account for. Spectrally convolved to matching bands, DESIS showed a consistent negative reflectance bias relative to Sentinel-2 across visible and near-infrared bands, pointing to a systematic atmospheric-correction discrepancy rather than random noise. Wyvern’s Dragonette data agreed strongly with Sentinel-2 on cloud-free dates, with divergence growing under higher cloud fractions. And a direct EMIT to DESIS comparison showed EMIT reading systematically higher across the large majority of survey sites, attributable to differing atmospheric-correction schemes, EMIT’s coarser pixels integrating more bare soil and litter, and a seasonal acquisition gap. The headline is that disagreement between sensors is structured and explicable, and must be characterised before any sensor can be trusted to separate spectrally similar communities.
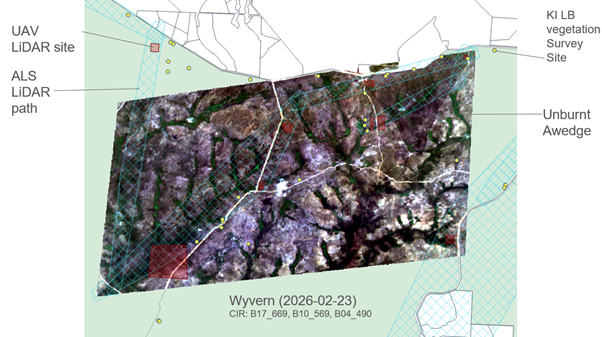 Wyvern dataset captured on the 2026-02-23 with UAV and airborne capture footprint
On the structural side, the LiDAR ladder is holding together well. Across 14 paired sites the dense drone and sparser airborne scans agreed almost exactly on canopy height, a mean difference of just −0.06 m and a concordance correlation of 0.99, while spanning the full structural range of the landscape, from low mallee around 7.9 m (P95 canopy height at SandersonFireTrack) to eucalypt woodland reaching nearly 25 m (24.6 m at WestBayCamp3). That agreement across an order-of-magnitude difference in point density is an early but important confirmation that structure measured by drone can be propagated through the airborne tier with confidence.
The potential: a fit-for-purpose framework
The pay-off SAEcoMap is working toward is an evidence-based framework for selecting hyperspectral satellites by purpose. It would replace the blanket assumption that finer spectral resolution always helps with a tested account of which sensors, at which resolutions, can actually separate invasive from native vegetation in these communities, and where the cost of commercial acquisition is justified over free multispectral data. The cross-sensor learning-curve experiments now underway are designed to isolate exactly that: the contribution of spectral resolution versus spectral range to classification accuracy at the community and sub-community level.
The applications that flow from this are concrete and directly relevant to the island’s managers: mapping and tracking invasive spread such as Tasmanian blue gum wildlings, sharper discrimination of native communities for conservation and fire-fuel assessment, more accurate biomass and carbon accounting through fused structural and spectral data, and support for threatened-species habitat recovery, including the KI Landscape Board’s work, all framed as scalable, cost-effective monitoring across large regions.
That is the ambition on Kangaroo Island. Not simply to document a recovery, but to turn one devastating summer into a rigorously tested, transferable toolkit for reading landscapes, and to settle, with data, whether the next generation of hyperspectral satellites can really distinguish the native bush from the invasive species establishing after fire.
Fabrice Marre
Senior Earth Observation Specialist